India’s annual average temperature increased from 25.05 ° C in 2001 to 25.74 ° C in 2024, with power generation from renewable sources to more than three times in 10 years. Bharat News

New Delhi: Showing a warming trend in the sink with overall global temperature rise, India’s annual average temperature increased from 25.05 ° C in 2001 to 25.74 ° C in 2024, which according to compilation of updated environmental data released on Thursday on World Environment Day.The year 2024 was the hottest in India since the nationwide record started in 1901. Even globally, 2024 was the hottest year in 175 years of observation record.
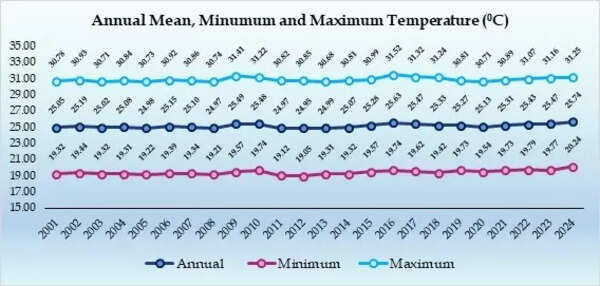
Compilation- Envistats India 2025: Environmental data showed that the annual minimum (night) and maximum (day) temperatures increased from 19.32 ° C to 20.24 ° C and 30.78 ° C to 31.25 ° C during 2021-24 respectively.It has also been shown that power generation from renewable energy sources in the country has increased more than three times in the last 10 years-2012 from 2012 to 2023-24 from 65,520 GW-Gentle (GWH) to 2,25,835 GWH-when thermal power generation has increased from 7,92,053 GWHH to 13,26,549 GWHH.
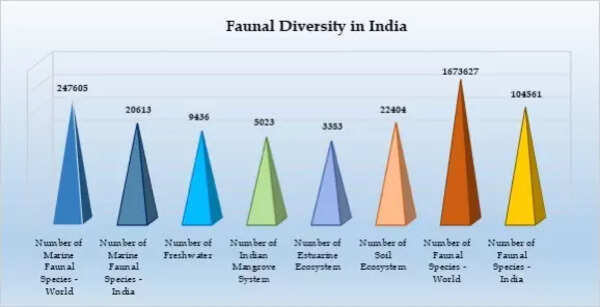
The data released by the Ministry of Statistics and Program Implementation has been compiled on the basis of data from central ministries and departments.This showed that globally, there are 2,47,605 Marine Funal species, including 20,613 from India. There are 9,436 freshwater species in the country, its mangrove system has 5,023 species, 3,383 species in Estunerin Ecosystem and 22,404 species in its soil ecosystem.As far as the total count of Foonal species is concerned, there are 16,73,627 species in the world, of which 1,04,561 are found in India, which outlines the country’s significant contribution to global funeral diversity in various houses.
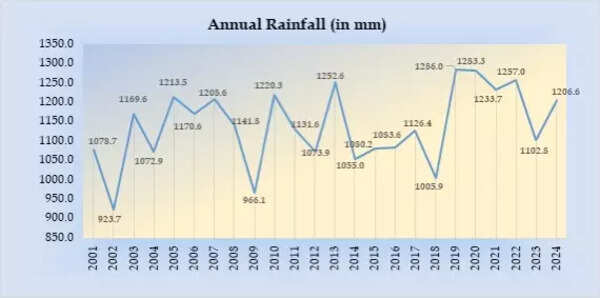
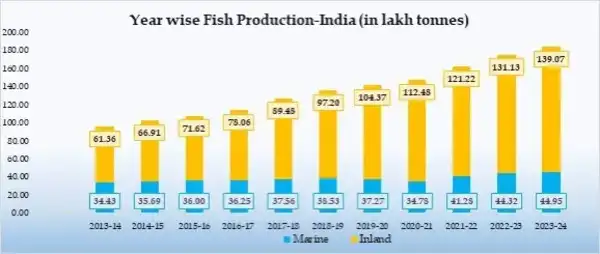
Referring to the inland fish, publication shows that its production has increased from 61 lakh tonnes in 2013-14 to 139 lakh tonnes in 2023-24. On the other hand, sea production, with slow growth, has increased from 34 lakh tonnes to about 45 million tonnes during the same period.Monthly rainfall data from 2001 to 2024 reveals seasonal variability, with most of the rainfall between June and September. Monthly ups and downs may suggest transferring rain patterns during the monsoon season such as late onset or prolonged rainfall in October, which may indicate to develop climatic conditions.
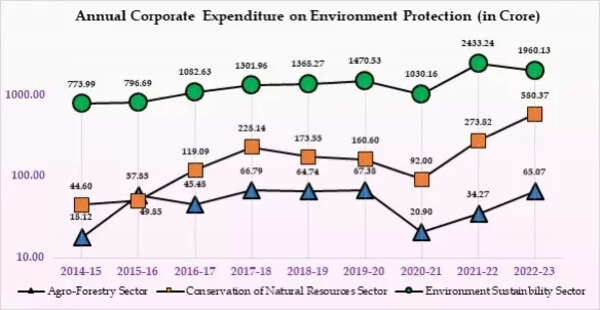
According to the compilation, the environment stability sector shows the highest expenditure share in 2021-22 with Rs 2433 crore between three regions (agricultural-slaughter, conservation of natural resources, and environmental stability). Protection of the natural resource sector reflects a trend on one upward while the agricultural-furtory sector costs the least.